Session 2: How to Work with Remote and Local Hazards#
Objective:
Learn about the basics of IN-CORE modules and objects.
Learn how to create and use hazards by using pyIncore and IN-CORE web services and how to create and use local hazards.
Agenda
1. Basics of IN-CORE modules
2. Working with Existing Hazards (Tornado and Earthquake)
2.1 Tornado hazards
2.1.1 Working with an existing tornado
2.1.2 Creating model-based tornado
2.1.3 Creating a dataset-driven tornado
2.2 Earthquake hazards
2.2.1 Working with existing earthquake hazards
2.2.2 Creating model-based earthquakes
2.2.3 Creating a dataset-driven earthquake (Probabilistic & Deterministic)
3. Working with Local Hazards
3.1 Basic Operations for Local Hazards
3.1.1 Tornadoes
3.1.2 Earthquakes
3.1.3 Tsunamis
3.1.4 Floods
3.1.5 Hurricanes
3.2 Visualizations for Local Hazards
3.2.1 Plotting a Tornado
3.2.2 Plotting an Earthquake
1. Basics of IN-CORE modules#
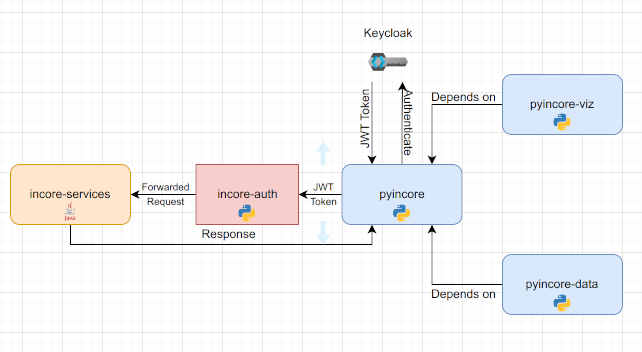
IN-CORE via pyincore provides a collection of Python classes that wrap the functionality for accessing the IN-CORE web services using Python methods. These classes provide access to Hazards, DFR3 curves, and Data.
To use IN-CORE in Jupyter Notebooks, we start by importing the modules we need.
We will first focus on how to effectively use the following modules within the IN-CORE architecture to request information about various hazards:
IncoreClient: this entity provides access and authentication to IN-CORE services. To access the services, users require to have a valid username and password. Importing
IncoreClientand creating a named instance of the client is the first step toward using IN-CORE by establishing a remote connection to various simulation and data access services. The variable containing that instance is used by various other services to validate the user’s identity, as well as provide access to pieces of information required across tasks. This step only needs to be done once.HazardService: once the
IncoreClienthas been initiated, theHazardServicemodule uses the information from that client to administer existing information about known or new hazards.HazardServicecan:Retrieve existing metadata for various hazards
Search hazards per specific information
Request creation of a new hazard
Request deletion of a new hazard
For more information on pyincore modules, see the documentation here: https://tools.in-core.org/doc/pyincore/index.html
To begin, let’s start by importing a few modules and creating our first IN-CORE objects.
# Import modules
import os
import json
from pyincore import HazardService, IncoreClient
# Connect to IN-CORE serivce by creating IncoreClient
# This only needs to be done once as indicated above
client = IncoreClient()

# Create a HazardService instance that depends on the client defined in the previous step
hazardsvc = HazardService(client)
2. Working with Existing Hazards (Tornado and Earthquake)#
2.1 Tornado hazards#
We will start by retrieving existing information about a specific tornado, and then using this information to create a slightly modified new tornado hazard scenario. These scenarios are representative of two of the most frequent tasks with IN-CORE: getting information from existing hazards and the creation of new hazards. We later also construct an example with a database-driven tornado.
These two tasks alone can enable decision makers to systematically construct, test and refine scenarios, later to be easily shared and discussed across response teams using Jupyter notebooks such as this.
2.1.1 Working with an existing tornado#
As with any given hazard, IN-CORE operates by utilizing hazard identification strings (hazard id) that uniquely name existing scenarios and are associated with data and metadata useful for analysis and visualization purposes. Metadata describe properties of the scenario, such as location and other details of the event.
With this identifier, let’s perform two tasks:
Obtain metadata about the tornado
Obtain hazard values, often used by decision makers during emergency planning and preparation
IN-CORE uses the JSON lightweight data-interchange format to store and retrieve
hazard information across its services as flexible way to share information in a standardized manner. We will use
Python’s json module to expand that information in a human-readable format.
Let’s start by using an identifier for one ficticious tornado in Memphis, TN stored as an IN-CORE dataset. We can find hazards on the IN-CORE service by using the hazard viewer here: https://tools.in-core.org/HazardViewer
# Example tornado in Memphis, TN (It's an imaginary tornado)
example_tornado_id = "60a44ae8605f0462bd4263ac"
Now, using the HazardService module, we retrieve the metadata and display it.
tornado_model_metadata = hazardsvc.get_tornado_hazard_metadata(example_tornado_id)
print(json.dumps(tornado_model_metadata, indent=4, sort_keys=False))
Using pyIncore_viz, we can now visualize the tornado hazard:
# Visualize the tornado using pyincore-viz
from pyincore_viz.geoutil import GeoUtil as viz
viz.plot_tornado(example_tornado_id, client, basemap=True)
# Interactive map to show the tornado path
# hovering mouse over the map shows lat/lon
import wsviz
wsviz.show_tornado(client, tornado_model_metadata)
All geographic locations in IN-CORE are specified using the WGS84 coordinate system. Observe that the parameters of the
json.dumps function are as follows:
the variable containing the resulting metadata
the indentation used to display the information contained in the JSON format
whether keys are sorted for convenient reading (no in our case).
We will discuss below the meaning of each element in this JSON output in the next section. Using the same service, we can obtain specific data about the hazard, in this case, the hazard values.
# Getting hazard value from your model
points = [
    {
        "demands": ["wind"],
        "units": ["mph"],
        "loc": "35.134, -90.031"
    }
]

tornado_model_vals = hazardsvc.post_tornado_hazard_values(example_tornado_id, points)
print(json.dumps(tornado_model_vals, indent=4, sort_keys=False))
### QUIZ: Please find the lat/lon of your location on the interactive map
### QUIZ: Then, acquire hazard value (wind speed) usin the code example above

mypoints = [
]
2.1.2 Creating model-based tornado#
One of IN-CORE strengths is the ability to specify, execute and retrieve information about new hazard scenarios using the same metadata standard.
As promised above, here is a description of each metadata (JSON) element representing a tornado hazard:
tornadoModel (required) - the tornado model (Mean width will create a tornado using the mean width from historical data for the EF rating)
Mean width tornado (MeanWidthTornado) - start/end points with a width equal to the average for that EF rating looking at historical tornado data
Random width tornado (RandomWidthTornado) - start/end points, random width selected use the historical data to determine the max width for that tornado rating
Mean Length/Width/angle (MeanLengthWidthAngleTornado) - start point, length/width and angle are based on the historical average for those attributes based on EF selected
Random length/width/angle (RandomLengthWidthAngleTornado) - start point, random length/width/angle selected for the ef rating using historical data
Random angle (RandomAngleTornado) - start point, random angle selected based on historical data.
efRating (required) - a value in the Enhanced Fujita (EF) scale intensity of the tornado (EF0 - EF5)
startLatitude/startLongitude (required) - the starting location of the tornado
endLatitude/endLongitude (optional)- depending on the model, an end latitude/longitude value. Some tornado models (e.g. mean length width, and angle) calcuate endLat and endLon, others (e.g. random angle) will generate multiple endpoints programmatically so the input must be passed as an array
windSpeedMethod(optional) - computation of wind speed within an EF boundary, 0 indicates using linear interpolation, 1 indicates uniform random distribution. Default is Uniform random distribution.
More information about the tornado models can be found here: https://ascelibrary.org/doi/10.1061/%28ASCE%29NH.1527-6996.0000138
As you may already anticipate, the particular JSON elements vary per each hazard type. We call these parameters. Some parameters are required (i.e. the analysis cannot be performed without them) and others are
Random Seeds: about the computational reproducibility of hazard scenarios#
Ensuring reproducibility of hazard scenarios is paramount for the IN-CORE team due to its scientific and decision-making consequences. Hence, care has been exercised to ensure that scenarios can be re-executed consistently in a standardized and simple manner.
Several models (such as this one) require generating pseudo-random numbers to simulate unexpected natural or human
effects, computational reproducibility of experiments can become somewhat challenging. IN-CORE harnesses the random
seed, a special number that determines the exact sequence random number generators (RNGs) produce to ensure
repeatability of that sequence independent of where the code is executed. The randomSeed parameter in IN-CORE
takes care of this aspect via an integer value that fixes the random number generating process regardless of when the
new analysis is requested or in which infrastructure it is executed.
Defining a new (slightly different) tornado#
With this information in hand, let’s construct a slightly different version of the same tornado. Let us imagine a less intense scenario with a longer trajectory due to conditions that preserve its energy for a longer time. While path length have been reported to increase as their EF rating increases, the case we describe here is plausible (See On the Relationship of Tornado Path Length and Width to Intensity).
To do so, we will vary:
the rating in the Enhanced Fujita (EF) rating from
"EF5"to"EF4",the start and end points to have a longer trajectory,
and the random number seed to ensure the RNG starts at values different from those in the original scenario.
The result of this process is
{
  "name": "Centerville Model Tornado (modified)",
  "description": "Centerville mean width tornado hazard",
  "tornadoType": "model",
  "tornadoModel" : "MeanWidthTornado",
      "tornadoParameters" : {
      "efRating" : "EF4",
      "startLatitude" : "35.215",
      "startLongitude" : "-97.524",
      "randomSeed" : "3457",
      "endLatitude" : [35.253],
      "endLongitude" : [-97.432],
      "windSpeedMethod" : "1",
      "numSimulations" : "1"
    }
}
We now proceed to create the model-based tornado with what we have learned so far. We take care to serialize the Python
dictionary structure into a JSON specification using json.dumps:
# Create a variable to store the new tornado hazard definition:

tornado_model_metadata = {
  "name": "Centerville Model Tornado (modified)",
  "description": "Centerville mean width tornado hazard",
  "tornadoType": "model",
  "tornadoModel" : "MeanWidthTornado",
      "tornadoParameters" : {
      "efRating" : "EF4",
      "startLatitude" : "35.215",
      "startLongitude" : "-97.524",
      "randomSeed" : "3457",
      "endLatitude" : [35.253],
      "endLongitude" : [-97.432],
      "windSpeedMethod" : "1",
      "numSimulations" : "1"
    }
}

tornado_model_json = json.dumps(tornado_model_metadata, indent=4)
Now, we create a tornado scenario, and retrieve the model response obtained from requesting IN-CORE to process it:
# Create a tornado with the prior definition
model_response = hazardsvc.create_tornado_scenario(tornado_model_json)
print(json.dumps(model_response, indent=4, sort_keys=False))
As with any analysis, we obtain the identifier of the specific response:
# Acquire hazard id you created
tornado_model_id = model_response['id']
viz.plot_tornado(tornado_model_id, client, basemap=True)
# Dispaly the path on the interactive map

wsviz.show_tornado(client, model_response)
As with the first case, we obtain the hazard values for this tornado:
# Getting hazard value from your model based tornado
points = [
    {
        "demands": ["wind"],
        "units": ["mph"],
        "loc": "35.215, -97.521"
    },
    {
        "demands": ["wind"],
        "units": ["mph"],
        "loc": "35.215, -97.519"
    }
]

tornado_model_vals = hazardsvc.post_tornado_hazard_values(tornado_model_id, points)
print(json.dumps(tornado_model_vals, indent=4, sort_keys=False))
2.1.3 Creating a dataset-driven tornado#
If you have a deterministic tornado dataset available outside IN-CORE, you can use pyincore to create a tornado dataset on the serivce. In this section, we present an example of how to do this.
The first step is to construct a hazard dataset description using JSON. In this example, we are creating a tornado dataset in Joplin:
tornado_dataset_data = {
  "name": "Joplin Dataset Tornado - workshop",
  "description": "Joplin tornado hazard with shapefile",
  "tornadoType": "dataset"
}

tornado_dataset_json = json.dumps(tornado_dataset_data, indent=4)
We also specify where the dataset files can be located (in our case, they have been provided to you in the local directory):
# zip file containing tornado path
file_paths = ["data/hazard/tornado/joplin_path_wgs84.shp",
              "data/hazard/tornado/joplin_path_wgs84.dbf",
              "data/hazard/tornado/joplin_path_wgs84.prj",
              "data/hazard/tornado/joplin_path_wgs84.shx"]
Using both the files and the JSON, we create a scenario tornado:
# Create a tornado with definition and file
dataset_response = hazardsvc.create_tornado_scenario(tornado_dataset_json, file_paths)
print(json.dumps(dataset_response, indent=4, sort_keys=False))
Similarly, we obtain the identifier of the output to the request (to HazardService):
# Display the path on the interactive map

wsviz.show_tornado(client, dataset_response)
Finally, we obtain the hazard values as usual.
# Getting hazard value from your dataset-based tornado
points = [
    {
        "demands": ["wind"],
        "units": ["mph"],
        "loc": "37.066, -94.502"
    },
    {
        "demands": ["wind"],
        "units": ["mph"],
        "loc": "37.032, -94.348"
    }
]

tornado_dataset_id = dataset_response['id']
tornado_dataset_vals = hazardsvc.post_tornado_hazard_values(tornado_dataset_id, points)
print(json.dumps(tornado_dataset_vals, indent=4, sort_keys=False))
2.2. Earthquake hazards#
Similar to Tornado in the last section, we will now replicate these steps for a different type of hazard: earthquakes. We will look at both model-based and database driven hazard scenarios (deterministic and probabilistic).
2.2.1 Working with existing earthquake hazards#
For this case, we will obtain metadata and hazard values for a 7.9 earthquake in Memphis, TN. Since we already have started
the IncoreClient and HazardService objects, we will not replicate the code here. Similar to Tornado, we can locate the hazard we want to work with by using the Hazard Viewer here: https://tools.in-core.org/HazardViewer
# Example earthquake in Memphis, TN
example_earthquake_id = '5b902cb273c3371e1236b36b'

# Obtain and display metadata
earthquake_model_metadata = hazardsvc.get_earthquake_hazard_metadata(example_earthquake_id)
print(json.dumps(earthquake_model_metadata, indent=4, sort_keys=False))
viz.plot_earthquake(example_earthquake_id, client)
# Display histogram of EQ
wsviz.show_eq_hist(client, earthquake_model_metadata)
# Get hazard values
points = [
    {
        "demands": ["0.2 SA"],
        "units": ["g"],
        "loc": "35.07899, -90.0178"
    },
    {
        "demands": ["0.2 SA", "PGA", "0.8 SA"],
        "units": ["g", "g", "g"],
        "loc": "35.027, -90.077"
    }
]
earthquake_model_vals = hazardsvc.post_earthquake_hazard_values(example_earthquake_id, points)
print(json.dumps(earthquake_model_vals, indent=4, sort_keys=False))
2.2.2 Creating model-based earthquakes#
Similar to the case of tornadoes, it is possible to create new model-based earthquakes through JSON parameters.
attenuations - attenuation models capture how energy is lost as seismic waves propagate. At present, IN-CORE supports the following ones:
AbrahamsonSilvaKamai2014
AtkinsonBoore1995
CampbellBozorgnia2014
ChiouYoungs2014
SadighChangEganMakdisiYoung1997
earthquake position (lat, lon), depth and magnitude - a description of the location and geophysical properties of the seismic event
demand type and demand units - a description of the quantity of interest and its units.
Following known steps for model-based tornados, we request computation of a new Memphis earthquake. In this case, we decrease the depth to 7.0 km and decrease the intensity to 6.5.
# Define the new earthquake
eq_model_metadata = {
  "name": "Memphis EQ Model (modified)",
  "description": "Memphis model based hazard",
  "eqType": "model",
  "attenuations" : {
    "AtkinsonBoore1995" : "1.0"
  },
  "eqParameters" : {
    "srcLatitude" : "35.927",
    "srcLongitude" : "-89.919",
    "magnitude" : "6.5",
    "depth" : "7.0"
  },
  "visualizationParameters" : {
    "demandType" : "PGA",
    "demandUnits" : "g",
    "minX" :"-90.3099",
    "minY" :"34.9942",
    "maxX" : "-89.6231",
    "maxY" : "35.4129",
    "numPoints" : "1025",
    "amplifyHazard": "true"
  }
}

eq_model_json = json.dumps(eq_model_metadata, indent=4)

# Create an earthquake with definition
eq_model_response = hazardsvc.create_earthquake(eq_model_json)

print(json.dumps(eq_model_response, indent=4, sort_keys=False))

# Acquire hazard id you created
eq_model_id = eq_model_response['id']

# Plot the earthquake
viz.plot_earthquake(eq_model_id, client)
# Getting hazard value from your model based earthquake

points = [
    {
        "demands": ["0.2 SA"],
        "units": ["g"],
        "loc": "35.07899, -90.0178"
    },
    {
        "demands": ["0.2 SA"],
        "units": ["g"],
        "loc": "35.027, -90.077"
    },
]

eq_model_vals = hazardsvc.post_earthquake_hazard_values(eq_model_id, points)
print(json.dumps(eq_model_vals, indent=4, sort_keys=False))
2.2.3 Creating a dataset-driven earthquake (Probabilistic & Deterministic)#
Finally, we show how datasets can be used to create earthquake scenarios. In this case, both deterministic and probabilistic alternatives are available. We concentrate here on a deterministic example.
For the example below, the earthquake datasets are provided as TIFF files.
As with the corresponding tornado example, specify the dataset(s) to be used:
eq_dataset_data = {
  "name":"Memphis Deterministic EQ",
  "description":"Memphis dataset based deterministic hazard",
  "eqType":"dataset",
  "hazardDatasets":[
    {
      "hazardType":"deterministic",
      "demandType":"SA",
      "demandUnits":"g",
      "period":"0.2",
      "eqParameters":{
        "srcLatitude":"35.927",
        "srcLongitude":"-89.919",
        "magnitude":"7.9",
        "depth":"10.0"
      }
    },
    {
      "hazardType":"deterministic",
      "demandType":"PGA",
      "demandUnits":"g",
      "period":"0.0",
      "eqParameters":{
        "srcLatitude":"35.927",
        "srcLongitude":"-89.919",
        "magnitude":"7.9",
        "depth":"10.0"
      }
    }
  ]
}


eq_dataset_json = json.dumps(eq_dataset_data, indent=4)
Similarly, specify where dataset files live:
file_paths = ["data/hazard/earthquake/eq-dataset-SA.tif", "data/hazard/earthquake/eq-dataset-PGA.tif"]
# order should be same as the hazardDatasets from above json
# eq-dataset-SA.tif represents 0.2 SA & eq-dataset-PGA.tif represents PGA
And finally, we create the earthquake and obtain hazard values from it:
# Create an dataset-based earthquake with definition and files
eq_dataset_response = hazardsvc.create_earthquake(eq_dataset_json, file_paths)
print(json.dumps(eq_dataset_response, indent=4, sort_keys=False))

# Acquire hazard id from recently created hazard
eq_dataset_id = eq_dataset_response['id']
viz.plot_earthquake(eq_dataset_id, client, "0.2 SA")
viz.plot_earthquake(eq_dataset_id, client, "PGA")
# Obtain hazard value from your dataset-based earthquakes
points = [
    {
        "demands": ["0.2 SA"],
        "units": ["g"],
        "loc": "35.07899, -90.0178"
    },
    {
        "demands": ["PGA"],
        "units": ["g"],
        "loc": "35.027, -90.077"
    },
]
eq_dataset_vals = hazardsvc.post_earthquake_hazard_values(eq_dataset_id, points)
print(json.dumps(eq_dataset_vals, indent=4, sort_keys=False))
3. Working with Local Hazards#
This section shows how to work with local hazards including tornadoes, earthquakes, tsunamis, floods, and hurricanes. It also has some example visualizations for tornadoes and earthquakes.
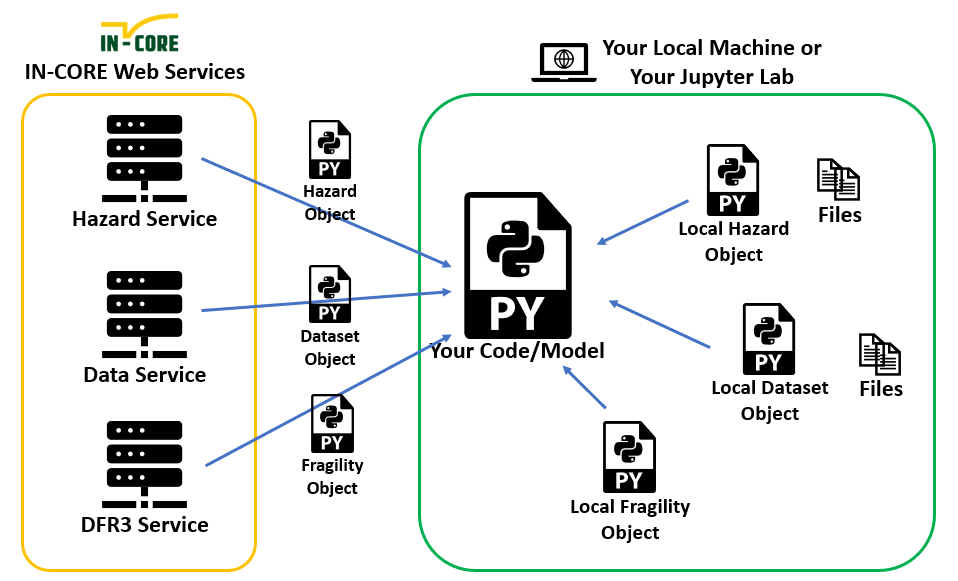
pyincore has several local hazard modules that enable users to perform analyses, tests, and visualization using data on their local machine without relying on the HazardService. The available modules are: Hurricane, Flood, Earthquake, Tornado, and Tsunamis. These modules allow a user to read local data into a hazard object and pass that object to pyincore analyses to obtain hazard information from the local data instead of the HazardService. We’ll see more on this later in session 4.
To get started, we need to import the local hazard modules we’ll be working with as shown below.
Note - local hazards currently support dataset (file) based only
# import local hazard modules
from pyincore import Hurricane, Flood, Earthquake, Tornado, Tsunami
3.1 Basic Operations for Local Hazards#
Let’s start with some basic operations for working with local hazards. Using the local hazard modules is straightforward. You can:
Create a hazard by providing a JSON file that describes the hazard (metadata).
Attach a dataset (file) to the hazard.
Get hazard values from hazard object.
For datasets, tornadoes use a Shapefile, while other hazards require a TIF (Tagged Image File) format. Now, let’s see how each type of hazard works.
3.1.1 Tornadoes#
Inputs: JSON representation of a dataset describing a tornado. Each available dataset in Shapefile format. For more information on the dataset type definition for a tornado, go here: https://tools.in-core.org/semantics/api/types/incore:tornadoWindfield
# indicate the path to the tornado dataset files
dir = "data/hazard/tornado/"

with open(os.path.join(dir, "tornado_dataset.json"), 'r') as file:
    tornado_dataset_json = file.read()
    print(json.dumps(json.loads(tornado_dataset_json), indent=4))
# create the tornado object
tornado = Tornado.from_json_file(os.path.join(dir, "tornado_dataset.json"))

# attach dataset from local file
tornado.hazardDatasets[0].from_file((os.path.join(dir, "joplin_path_wgs84.shp")),
                                    data_type="incore:tornadoWindfield")

payload = [
    {
        "demands": ["wind"],
        "units": ["mph"],
        "loc": "-94.37, 37.04"
    }
]

# get values
values = tornado.read_hazard_values(payload, seed=1234) # removing the seed will give random values
print(json.dumps(values, indent=4, sort_keys=False))
3.1.2 Earthquakes#
Inputs: JSON representation of a dataset describing an earthquake. Each available dataset in TIF format.
# indicate the path
dir = 'data/hazard/earthquake/'

earthquake_dataset_json = ''
with open(os.path.join(dir, "eq-dataset.json"), 'r') as file:
    earthquake_dataset_json = file.read()
    print(json.dumps(json.loads(earthquake_dataset_json), indent=4))
# create the earthquake object
eq = Earthquake.from_json_file(os.path.join(dir, "eq-dataset.json"))

# attach datasets from local files
eq.hazardDatasets[0].from_file((os.path.join(dir, "eq-dataset-SA.tif")),
                               data_type="ergo:probabilisticEarthquakeRaster")
eq.hazardDatasets[1].from_file((os.path.join(dir, "eq-dataset-PGA.tif")),
                               data_type="ergo:probabilisticEarthquakeRaster")

payload = [
    {
        "demands": ["PGA", "0.2 SA"],
        "units": ["g", "g"],
        "loc": "35.03,-89.93"
    }
]

# get values
values = eq.read_hazard_values(payload)
print(json.dumps(values, indent=4, sort_keys=False))
3.1.3 Tsunamis#
Inputs: JSON representation of a dataset describing a tsunami. Each available dataset in TIF format.
# indicate the path
dir = 'data/hazard/tsunami/'

with open(os.path.join(dir, "tsunami.json"), 'r') as file:
    tsunami_dataset_json = file.read()
    print(json.dumps(json.loads(tsunami_dataset_json), indent=4))
# create the tsunami object
tsunami = Tsunami.from_json_file(os.path.join(dir, "tsunami.json"))

# attach datasets from local files
tsunami.hazardDatasets[0].from_file((os.path.join(dir, "Tsu_100yr_Vmax.tif")),
                                    data_type="ncsa:probabilisticTsunamiRaster")
tsunami.hazardDatasets[1].from_file((os.path.join(dir, "Tsu_100yr_Mmax.tif")),
                                    data_type="ncsa:probabilisticTsunamiRaster")
tsunami.hazardDatasets[2].from_file((os.path.join(dir, "Tsu_100yr_Hmax.tif")),
                                    data_type="ncsa:probabilisticTsunamiRaster")

payload = [
    {
        "demands": ["hmax"],
        "units": ["m"],
        "loc": "46.006,-123.935"
    }
]

# get values
values = tsunami.read_hazard_values(payload)
print(json.dumps(values, indent=4, sort_keys=False))
3.1.4 Floods#
Inputs: JSON representation of a dataset describing a flood. Each available dataset in TIF format.
# indicate the path
dir = 'data/hazard/flood/'

with open(os.path.join(dir, "flood-dataset.json"), 'r') as file:
    flood_dataset_json = file.read()
    print(json.dumps(json.loads(flood_dataset_json), indent=4))
# create the flood object
flood = Flood.from_json_file(os.path.join(dir, "flood-dataset.json"))

# attach datasets from local files
flood.hazardDatasets[0].from_file((os.path.join(dir, "flood-inundationDepth-50ft.tif")),
                                  data_type="ncsa:probabilisticFloodRaster")
flood.hazardDatasets[1].from_file(os.path.join(dir, "flood-WSE-50ft.tif"),
                                  data_type="ncsa:probabilisticFloodRaster")

payload = [
    {
         "demands": ["waterSurfaceElevation"],
         "units": ["m"],
         "loc": "34.60,-79.16"
     }
 ]

# get values
values = flood.read_hazard_values(payload)
print(json.dumps(values, indent=4, sort_keys=False))
3.1.5 Hurricanes#
Inputs: JSON representation of a dataset describing a hurricane. Each available dataset in TIF format.
# indicate the path
dir = 'data/hazard/hurricane/'

with open(os.path.join(dir, "hurricane-dataset.json"), 'r') as file:
    hurricane_dataset_json = file.read()
    print(json.dumps(json.loads(hurricane_dataset_json), indent=4))
# create the hurricane object
hurricane = Hurricane.from_json_file((os.path.join(dir, "hurricane-dataset.json")))

# attach datasets from local files
hurricane.hazardDatasets[0].from_file((os.path.join(dir, "Wave_Raster.tif")),
                                      data_type="ncsa:deterministicHurricaneRaster")
hurricane.hazardDatasets[1].from_file(os.path.join(dir, "Surge_Raster.tif"),
                                      data_type="ncsa:deterministicHurricaneRaster")
hurricane.hazardDatasets[2].from_file(os.path.join(dir, "Inundation_Raster.tif"),
                                      data_type="ncsa:deterministicHurricaneRaster")

payload = [
        {
            "demands": ["waveHeight", "surgeLevel"],
            "units": ["m", "m"],
            "loc": "29.22,-95.06"
        },
        {
            "demands": ["waveHeight", "surgeLevel"],
            "units": ["cm", "cm"],
            "loc": "29.23,-95.05"
        },
        {
            "demands": ["waveHeight", "inundationDuration"],
            "units": ["in", "hr"],
            "loc": "29.22,-95.06"
        }
    ]

# get values
values = hurricane.read_hazard_values(payload)
print(json.dumps(values, indent=4, sort_keys=False))
3.2 Visualizations for Local Hazards#
In this section, we provide examples to show how to plot local tornadoes and earthquakes.
3.2.1 Plotting a tornado#
In this example, we are using the identical tornado dataset discussed in Section 3.1.1. You will need to create a tornado object and attach the local shape file to the object.
# indicate the path
dir = "data/hazard/tornado/"

# create the tornado object
tornado = Tornado.from_json_file(os.path.join(dir, "tornado_dataset.json"))

# attach dataset from local file
tornado.hazardDatasets[0].from_file((os.path.join(dir, "joplin_path_wgs84.shp")),
                                    data_type="incore:tornadoWindfield")
Then, we can plot the local shape file.
gdf = tornado.hazardDatasets[0].dataset.get_dataframe_from_shapefile()
id_field = tornado.EF_RATING_FIELD

map = viz.plot_gdf_map(gdf, id_field)
map
# Use GeoDataframe.explore() to interact with the map
gdf.explore(
    column="ef_rating",
    tooltip="ef_rating",
    popup=True,
    cmap="Set1"  # use "Set1" matplotlib colormap)
)
3.2.2 Plotting an Earthqauke#
In this example, we are using the identical earthquake dataset discussed in Section 3.1.2. Similary, you will need to create an earthquake object and attach the local tif files to the object.
# indicate the path
dir = 'data/hazard/earthquake/'

# create the earthquake object
eq = Earthquake.from_json_file(os.path.join(dir, "eq-dataset.json"))

# attach datasets from local files
eq.hazardDatasets[0].from_file((os.path.join(dir, "eq-dataset-SA.tif")),
                               data_type="ergo:probabilisticEarthquakeRaster")
eq.hazardDatasets[1].from_file((os.path.join(dir, "eq-dataset-PGA.tif")),
                               data_type="ergo:probabilisticEarthquakeRaster")
Then, we can plot the local tif files.
# display the earthquake
for earthquake in eq.hazardDatasets:
    demand_type = earthquake.demand_type
    period = earthquake.period
    title = "Demand Type: " + demand_type.upper() + ", Period: " + str(period)
    raster_file_path = earthquake.dataset.local_file_path

    viz.plot_raster_file_with_legend(raster_file_path, title)
Session review#
With the experience gained in this session, you should now be able to:
Initialize
IncoreClientandHazardServiceobjects to authenticate to and access IN-CORE resourcesUnderstand how to use pyincore modules to create and use existing hazards in the IN-CORE web service as well as obtain hazard values
Use pyincore local hazard modules to work local hazard data
Visualize local and remote hazards using pyincore-viz and GeoPandas
Hands-on Assignment#
For the next part of this session, please open “session2-assignment.ipynb”.