Session 4: Visualization of outputs#
You will learn how to visualize the input/output datasets
# import pyIncore modules
from pyincore import IncoreClient, FragilityService, FragilityCurveSet, MappingSet, Dataset
# Connect to IN-CORE service
client = IncoreClient()
Connection successful to IN-CORE services. pyIncore version detected: 0.9.3
fragility_services = FragilityService(client)
1. Joining Dataset#
Data preparation and data post-processing are common procedures. Prior to using pyIncore, users often encounter situation that they need to reshape their own dataset to make it compliant with the input dataset format of pyIncore.
For example, adding GUID to inventory dataset. GUID (aka UUID) is an acronym for ‘Globally Unique Identifier’. It is a 128-bit integer number used to identify resources. In IN-CORE We require each individual row/item in an inventory to have its own GUID. If your dataset does not come with GUID, pyIncore has utility method to help you add it.
After acquiring outputs from pyIncore analyses, often time user would need to perform data aggregation to gain statitical insights. The below tutorial gives a few examples on how to join datasets and generate some basic visualizations.
Step 1: Running building dmg analysis (Tornado)#
# create a local dataset with buiding inventory data
local_buildings = Dataset.from_file("sample_bldgs_w_guid.shp", data_type="ergo:buildingInventoryVer7")
# import building damage analysis class
from pyincore.analyses.buildingdamage import BuildingDamage
# Define the variables to be used for input parameters
hazard_type = "earthquake"
hazard_id = "5b902cb273c3371e1236b36b"
result_name = "memphis_eq_bldg_dmg_result"
mapping_id = "5b47b350337d4a3629076f2c"

# create fragility mapping object with id
eq_mapping_set = MappingSet(fragility_services.get_mapping(mapping_id))

# Create building damage analysis object
eq_bldg_dmg = BuildingDamage(client)

eq_bldg_dmg.set_input_dataset("buildings", local_buildings)
eq_bldg_dmg.set_input_dataset("dfr3_mapping_set", eq_mapping_set)
eq_bldg_dmg.set_parameter("result_name", result_name)
eq_bldg_dmg.set_parameter("hazard_type", hazard_type)
eq_bldg_dmg.set_parameter("hazard_id", hazard_id)
eq_bldg_dmg.set_parameter("num_cpu", 4)

# Run building damage analysis
eq_bldg_dmg.run_analysis()
True
eq_bldg_dmg.get_output_dataset("ds_result").get_dataframe_from_csv().head()
| guid | LS_0 | LS_1 | LS_2 | DS_0 | DS_1 | DS_2 | DS_3 | |
|---|---|---|---|---|---|---|---|---|
| 0 | ac8b0b44-ae82-4c48-afb8-076e2d16c7e5 | 0.848149 | 0.327322 | 2.722964e-02 | 0.151851 | 0.520827 | 0.300092 | 2.722964e-02 |
| 1 | 154b0a62-cae6-456d-8d90-635e3e1c2dcb | 0.844343 | 0.328299 | 2.860543e-02 | 0.155657 | 0.516043 | 0.299694 | 2.860543e-02 |
| 2 | 9f9b11f8-c25c-4760-b1d2-a63bbeec8e72 | 0.896774 | 0.480925 | 8.756720e-02 | 0.103226 | 0.415849 | 0.393358 | 8.756720e-02 |
| 3 | 28321416-e473-473b-ad0a-c3c38248acc7 | 0.828098 | 0.293753 | 2.738378e-02 | 0.171902 | 0.534345 | 0.266369 | 2.738378e-02 |
| 4 | b5069250-7a2b-47b1-9754-290528a6d72d | 0.970343 | 0.154677 | 1.000000e-10 | 0.029657 | 0.815666 | 0.154677 | 1.000000e-10 |
Step 2: Joining two datasets#
# getting dataframe of damage output
eq_bldg_dmg_df = eq_bldg_dmg.get_output_dataset("ds_result").get_dataframe_from_csv()

# getting geodataframe of building dataset
bldg_gdf = local_buildings.get_dataframe_from_shapefile()

# merge/join two dataframe
# you can choose columns to be merged
bldg_dmg_gdf = bldg_gdf[['guid', 'struct_typ', 'geometry']].merge(eq_bldg_dmg_df, on='guid')
bldg_dmg_gdf.head()
| guid | struct_typ | geometry | LS_0 | LS_1 | LS_2 | DS_0 | DS_1 | DS_2 | DS_3 | |
|---|---|---|---|---|---|---|---|---|---|---|
| 0 | ac8b0b44-ae82-4c48-afb8-076e2d16c7e5 | C1 | POINT (-90.02585 35.14020) | 0.848149 | 0.327322 | 2.722964e-02 | 0.151851 | 0.520827 | 0.300092 | 2.722964e-02 |
| 1 | 154b0a62-cae6-456d-8d90-635e3e1c2dcb | C1 | POINT (-90.02585 35.14020) | 0.844343 | 0.328299 | 2.860543e-02 | 0.155657 | 0.516043 | 0.299694 | 2.860543e-02 |
| 2 | 9f9b11f8-c25c-4760-b1d2-a63bbeec8e72 | S1 | POINT (-90.01928 35.13640) | 0.896774 | 0.480925 | 8.756720e-02 | 0.103226 | 0.415849 | 0.393358 | 8.756720e-02 |
| 3 | 28321416-e473-473b-ad0a-c3c38248acc7 | URM | POINT (-90.07377 35.12344) | 0.828098 | 0.293753 | 2.738378e-02 | 0.171902 | 0.534345 | 0.266369 | 2.738378e-02 |
| 4 | b5069250-7a2b-47b1-9754-290528a6d72d | S1 | POINT (-90.04349 35.15360) | 0.970343 | 0.154677 | 1.000000e-10 | 0.029657 | 0.815666 | 0.154677 | 1.000000e-10 |
2. Using Pandas#
You can use Pandas and GeoPandas to dispaly tabular data and create charts. This secsion shows some examples.
# Stat summary on a column
bldg_dmg_gdf["LS_0"].describe()
count    22.000000
mean      0.828967
std       0.106217
min       0.590205
25%       0.759679
50%       0.850892
75%       0.888729
max       0.993698
Name: LS_0, dtype: float64
# Show table sorted by DS_3 (decending) and struct_typ (ascending)

bldg_dmg_gdf.sort_values(['DS_3', 'struct_typ'], ascending=[0,1]).head()
| guid | struct_typ | geometry | LS_0 | LS_1 | LS_2 | DS_0 | DS_1 | DS_2 | DS_3 | |
|---|---|---|---|---|---|---|---|---|---|---|
| 14 | 6dd342ef-498c-43a9-85cd-35ad76e4c279 | W2 | POINT (-89.77456 35.20624) | 0.856181 | 0.446936 | 0.094468 | 0.143819 | 0.409244 | 0.352468 | 0.094468 |
| 2 | 9f9b11f8-c25c-4760-b1d2-a63bbeec8e72 | S1 | POINT (-90.01928 35.13640) | 0.896774 | 0.480925 | 0.087567 | 0.103226 | 0.415849 | 0.393358 | 0.087567 |
| 11 | d7603d04-6917-478c-8bb7-50cf9118f973 | S1 | POINT (-89.86438 35.09755) | 0.880047 | 0.445912 | 0.074362 | 0.119953 | 0.434135 | 0.371550 | 0.074362 |
| 6 | 11395729-3727-449d-9848-778d68edd7d8 | S1 | POINT (-90.04349 35.15360) | 0.923829 | 0.491034 | 0.070220 | 0.076171 | 0.432794 | 0.420815 | 0.070220 |
| 21 | 3ef119b1-6432-4875-aa26-9dbf571388f1 | S1 | POINT (-89.80149 35.09272) | 0.891623 | 0.413491 | 0.047434 | 0.108377 | 0.478133 | 0.366056 | 0.047434 |
# Show table group by Structure type
grouped_bldg_dmg = bldg_dmg_gdf.groupby(by=['struct_typ'], as_index=True)\
.agg({'DS_0': 'mean', 'DS_1':'mean', 'DS_2': 'mean', 'DS_3': 'mean', 'guid': 'count'})
grouped_bldg_dmg.rename(columns={'guid': 'total_count'}, inplace=True)
grouped_bldg_dmg.head()
| DS_0 | DS_1 | DS_2 | DS_3 | total_count | |
|---|---|---|---|---|---|
| struct_typ | |||||
| C1 | 0.188494 | 0.524856 | 0.264423 | 0.022226 | 7 |
| C2 | 0.204050 | 0.519597 | 0.252735 | 0.023617 | 1 |
| S1 | 0.137610 | 0.578995 | 0.249515 | 0.033880 | 11 |
| URM | 0.171902 | 0.534345 | 0.266369 | 0.027384 | 1 |
| W2 | 0.276807 | 0.438296 | 0.234968 | 0.049929 | 2 |
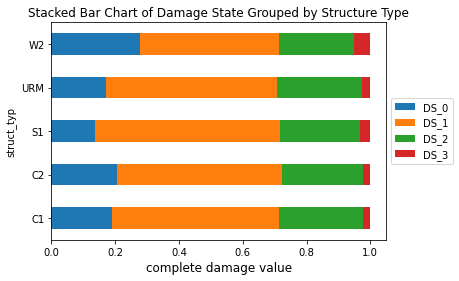
# Plot Damage state by structure type
ax = grouped_bldg_dmg[["DS_0", "DS_1", "DS_2", "DS_3"]].plot.barh(stacked=True)
ax.set_title("Stacked Bar Chart of Damage State Grouped by Structure Type", fontsize=12)
ax.set_xlabel("complete damage value", fontsize=12)
ax.legend(loc='center left', bbox_to_anchor=(1.0, 0.5)) #here is the magic
<matplotlib.legend.Legend at 0x7fe4e16ed6d0>
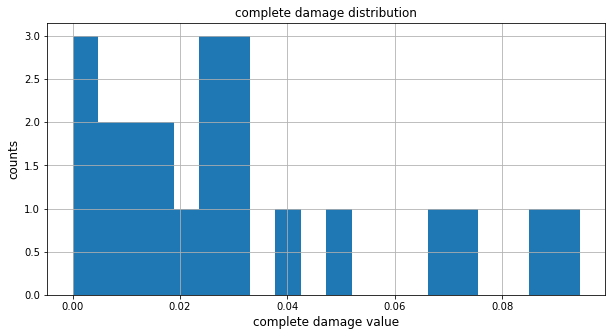
# Create a histogram with DS_3

ax = bldg_dmg_gdf['DS_3'].hist(bins=20, figsize=[10,5])
ax.set_title("complete damage distribution", fontsize=12)
ax.set_xlabel("complete damage value", fontsize=12)
ax.set_ylabel("counts", fontsize=12)
Text(0, 0.5, 'counts')
3. Using pyIncore-viz#
pyIncore-viz is a Python visualization package for pyIncore module. It provides users with convenient methods to create image and graphic outputs of various hazard IN-CORE analyses.
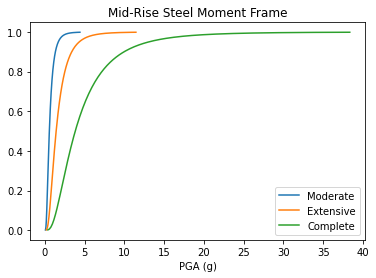
3.1 Plotting Fragility curves#
# visualize this fragility curve using pyincore-viz package
from pyincore_viz.plotutil import PlotUtil as plot
# Plot fragility curves

fragility_set_id = "5b47b2d7337d4a36187c61ce"

# Get local fragility curve set
fragility_curve_set = FragilityCurveSet(fragility_services.get_dfr3_set(fragility_set_id))
fragility_curve_set.fragility_curves

plt = plot.get_fragility_plot(fragility_curve_set, title="Mid-Rise Steel Moment Frame")
plt.show()
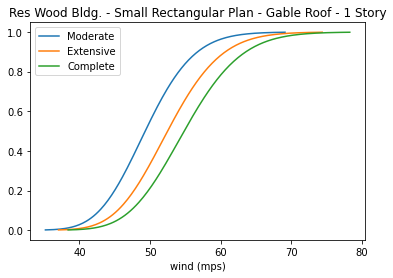
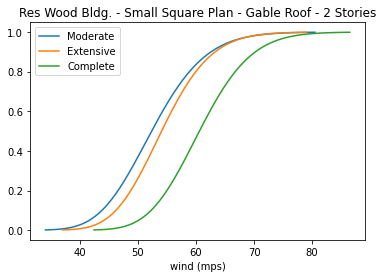
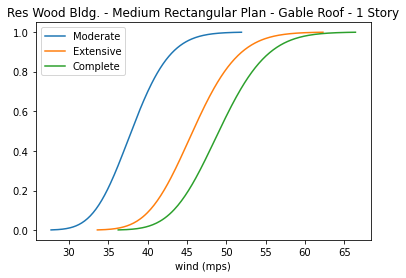
#plot fragility curves of tornado building by going through mapping

fragility_service = FragilityService(client)
mapping_id = "5d8942dfb9219c068ea795ea"
mapping_set = MappingSet(fragility_service.get_mapping(mapping_id))

# plot fragility for the first 3 archetypes using pyincore viz method
for mapping in mapping_set.mappings[:3]:
    fragility_id = mapping.entry['Non-Retrofit Fragility ID Code']
    fragility_set = FragilityCurveSet(fragility_service.get_dfr3_set(fragility_id))
    plt = plot.get_fragility_plot(fragility_set)
    plt.show()
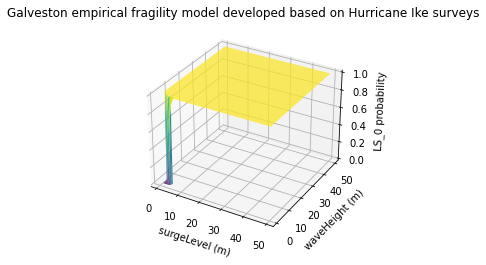
# Plot fragility curves (parametric curves)

# use utility method of pyicore-viz package to visulaize the fragility
fragility_set = FragilityCurveSet(FragilityService(client).get_dfr3_set("5f6ccf67de7b566bb71b202d"))
plt = plot.get_fragility_plot_3d_refactored(fragility_set,
                                            title="Galveston empirical fragility model developed "
                                            "based on Hurricane Ike surveys",
                                            limit_state="LS_0")
plt.show()
3.2 Plot Geospatial Map#
Plotting a geospatial map is generating static image of a map.
from pyincore_viz.geoutil import GeoUtil as geoviz
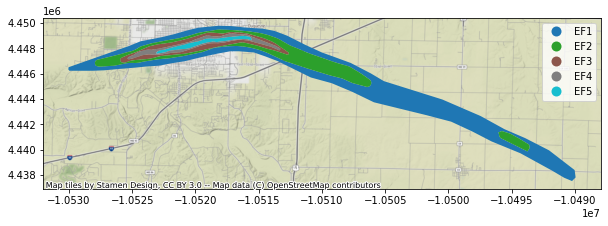
# Plot tornado path

tornado_path_id = "5d07cbeab9219c065b080930"
geoviz.plot_tornado(tornado_path_id, client, basemap=True)
Dataset already exists locally. Reading from local cached zip.
Unzipped folder found in the local cache. Reading from it...
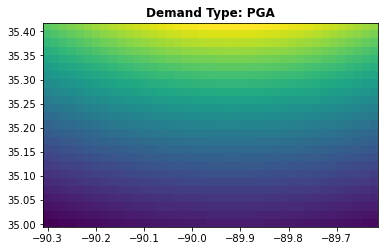
# Plot earthquake

eq_id = "5b902cb273c3371e1236b36b"
geoviz.plot_earthquake(eq_id, client)
Dataset already exists locally. Reading from local cached zip.
Unzipped folder found in the local cache. Reading from it...
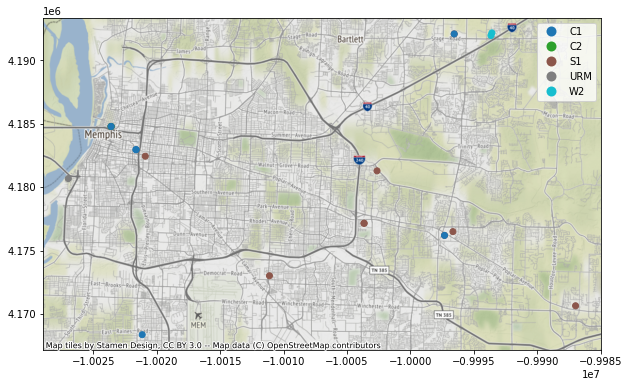
# Plot a map with a Dataset
# with local dataset (local_buildings)

geoviz.plot_map(local_buildings, column='struct_typ',category='True')
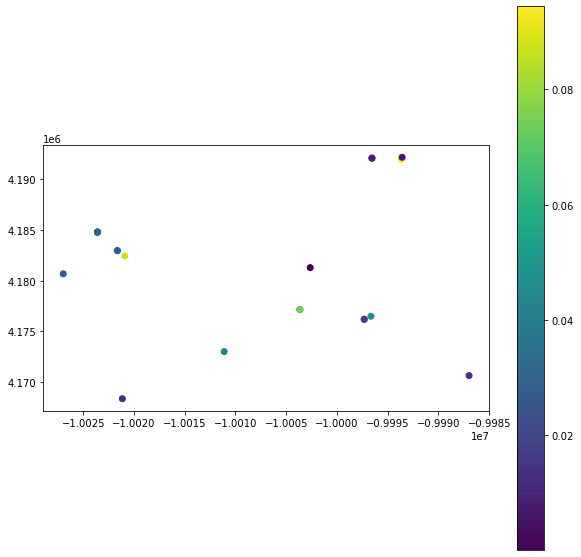
# Plot a map with GeoDataframe

geoviz.plot_gdf_map(bldg_dmg_gdf, 'DS_3', basemap=False)
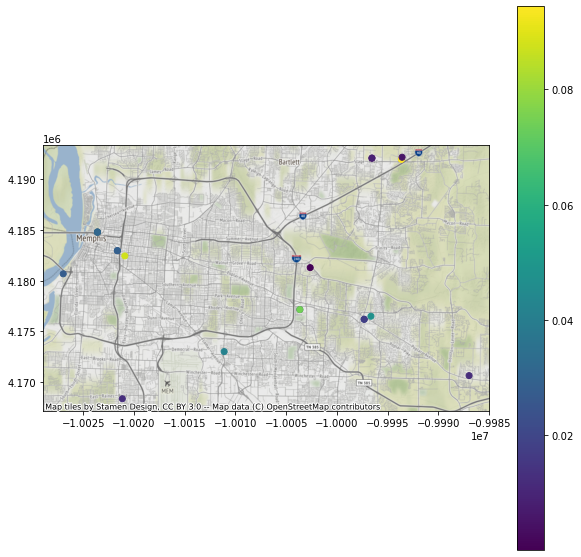
# Plot a map with GeoDataframe

geoviz.plot_gdf_map(bldg_dmg_gdf, 'DS_3', basemap=True)
# Interactive map with Dataset
# addjust additional multiplier to increase the intensity of heatmap, e.g. multipler=1000
map = geoviz.plot_heatmap_from_gdf(bldg_dmg_gdf, "DS_3", radius=7, blur=5, name="DS_3", multiplier=1000)
map
Hands-on Assignment#
Please open session4-assignment.ipynb.