Session 3: Building Damage Analysis#
You will learn about fragility curves and mappping, building inventory dataset, and buiding damage analysis by using IN-CORE in this session
3.1 Fragility Curve and Mapping#
Damage analyses use fragility curve sets to calculate the limit state and damage stsate. Mapping then determines which fragility curve set applying to which inventory. For example, a building that has certain number of stories could be mapped to a specific set of fragility curves.
In IN-CORE, A user can both upload a set of fragility curves and mapping to the DFR3 services, or use local curve and mapping set objects.
This section briefly shows how to access fragility curves. A detailed instrcution of how to create your own fragility entities and mapping entities can be found in our Mannual: Toutorial - Create DFR3 Object
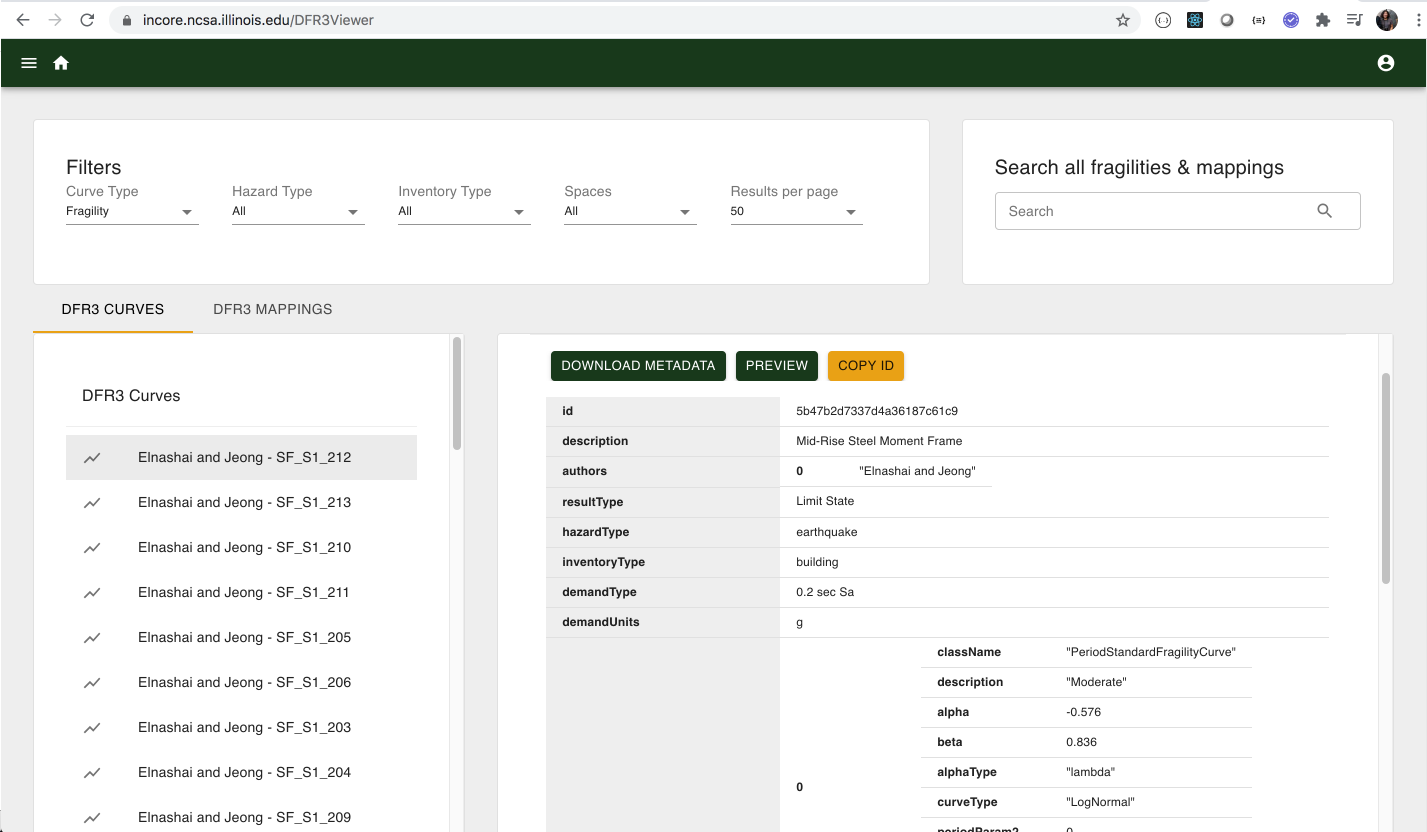
User can easily browsing and searching Fragility Curves and Mappings via DFR3 Viewer
Analyses use DFR3 mapping sets from IN-CORE service to associate each element of a given set with one or more elements of a second set of DFR3 curves. In IN-CORE and pyIncore specifically, a building inventory (given set) is mapped to a (second) set of fragility curves.
Please note that in this notebook we use term function/method interchangably in programming context as a class function and curve as a function in mathematical context (lognormal curve).
Read fragility curve set#
# import pyIncore modules
from pyincore import FragilityService, IncoreClient, FragilityCurveSet, MappingSet

# Connect to IN-CORE service
client = IncoreClient()

# Initalize a FragilityService
fragility_services = FragilityService(client)
# Getting a fragility curve and metadata
# You can see the curve with this ID at DFR3 viewer
fragility_set_id = "5b47b2d7337d4a36187c61ce"

# Get local fragility curve set
fragility_curve_set = FragilityCurveSet(fragility_services.get_dfr3_set(fragility_set_id))
fragility_curve_set.fragility_curves
Visualize this fragility curve using pyincore-viz package#
from pyincore_viz.plotutil import PlotUtil as plot

plt = plot.get_fragility_plot(fragility_curve_set, title="Mid-Rise Steel Moment Frame")
plt.show()
3.2 Building Inventory#
The schema (columns) of building Inventory has been going through several iteration (v5, v6, v7), and here is a list of supported column names in version 6. Having a fully populated Building Inventory, with no additional columns, will hold all the data needed to perform all analyses that are compatible with that version of the Building Inventory.
column name |
description |
type |
|---|---|---|
GUID |
added by IN-CORE |
string |
ARCHETYPE |
building structure archetype |
integer |
OCC_TYPE |
Broad HAZUS Occupancy Category (e.g. RES3 - multi-family residential) |
string |
APPR_BLDG |
Appraised value for the building |
double |
SQ_FOOT |
total building area in square feet |
integer |
DWELL_UNIT |
total number of dwelling units in the building |
integer |
NO_STORIES |
total number of stories for the building |
integer |
CONT_VAL |
value of building contents |
double |
STR_TYP2 |
detailed structure type as per HAZUS MR-3 specifications |
string |
EFACILITY |
essential facility designation |
string |
PAR_ID |
parcel identifier |
string |
PARID_CARD |
improvement identifier |
string |
BLDG_ID |
building identifier (unique) |
string |
STR_PROB |
probability that the structure type specified is correct |
double |
YEAR_BUILT |
the year the structure was built |
integer |
A_STORIES |
the number of above ground stories |
integer |
B_STORIES |
the number of below ground stories |
integer |
BSMT_TYPE |
the basement type |
string |
GSQ_FOOT |
total ground floor area of the building in square feet |
integer |
OCC_DETAIL |
“specific occupancy category, describing the detailed use of the building” |
string |
MAJOR_OCC |
major occupancy category for the parcel in which the building is sited |
string |
BROAD_OCC |
general occupancy categories |
string |
REPL_CST |
replacement cost for the building from R.S. means square foot cost |
double |
STR_CST |
structural component of the replacement cost |
double |
NSTRA_CST |
acceleration sensitive component of replacement cost |
double |
NSTRD_CST |
drift sensitive component of replacement cost |
double |
DGN_LVL |
design level for the building as per HAZUS MR-3 specifications |
string |
OCC_TYP2 |
detailed HAZUS occupancy category for the building |
string |
TRACT_ID |
census tract identifier |
string |
There are many ways to create building inventory dataset; for example 1) using GIS software (e.g. ArcGIS, QGIS, etc), 2) using python code. In this exerercise, we will create a buiding inventory dataset in ESRI Shapefile from CSV file by using GeoPandas library.
GeoPandas is an open source project to make working with geospatial data in python easier. GeoPandas extends the datatypes used by pandas to allow spatial operations on geometric types. For more information, please follow the user guide
Create a dataset object#
Any analysis in pyIncore, by default uses Dataset Object as an input. Hence we have to convert building dataset into pyincore dataset object, in order to use it as an input for damage analysis. We can either upload the dataset to IN-CORE data services to acquire an id; or using existing dataset id from the services; or using local files.
Create building inventory dataset object from local files#
Below we will create a buidling inventory data in ESRI shapefile from CSV file according to building inventory schema. With the files, we will create a local dataset object.
# import Dataset class
from pyincore import Dataset
Step 1: Convert CSV file to ESRI Shapefile#
Open CSV file in the file browser to see the contents.
# Load CSV file into GeoPandas, then export the GeoDataFrame to ESRI shapefile

import pandas as pd
import geopandas as gpd

df = pd.read_csv('ergo_memphis_hospitals.csv')

gdf = gpd.GeoDataFrame(df, crs='epsg:4326', geometry=gpd.points_from_xy(df.lon, df.lat))
gdf.to_file("sample_bldgs.shp")
Step 2: Add GUID#
Each built-in infrastructure needs a GUID. A GUID is an acronyom that stands for Globally Unique Identifier, they are also referred to as UUIDs or Universaly Unique Identifiers. Technically they are 128-bit unique reference numbers used in computing which are highly unlikely to repeat when generated.
# pyincore has utility methods help user easily add GUID
from pyincore import GeoUtil

GeoUtil.add_guid("sample_bldgs.shp", "sample_bldgs_w_guid.shp")
Step 3: Create a local dataset for IN-CORE#
The following code create a local Dataset object with ESRI shapefile for buiding inventory
# use the method "from_file" in Dataset class to construct dataset object from local file
local_buildings = Dataset.from_file("sample_bldgs_w_guid.shp", data_type="ergo:buildingInventoryVer7")
(Optional) Create a dataset from IN-CORE Data Service#
A dataset can be also loaded from data service with an id. pyIncore has utility methods to download the files and metadata from the data service to create a dataset obejct in local.
(Optional) Upload local dataset to IN-CORE Data Service and get ID#
Write Metadata: Metadata is a string describing the dataset.
dataType needs to be align with the analyses in pyincore.
format is the file format of the dataset. Currently we support “shapefile”, “table”, “Network”, “textFiles”, “raster”, “geotiff” and etc. Please consult with development team if you intend to post a new format.
3.3 Configure the Building Damage Analysis#
This analysis computes building damage based on a particular hazard. In this secion, you will perform building damage anlayis for both scenario earthquake and tornado.
The process for computing the structural damage is similar to other parts of the built environment. First, a fragility is obtained based on the hazard type and attributes of the building. Based on the fragility, the hazard intensity at the location of the building is computed. Using this information, the probability of exceeding each limit state is computed, along with the probability of damage. For the case of an earthquake hazard, soil information can be used to modify the damage probabilities to include damage due to liquefaction.
The outputs of this analysis are CSV file with probabilities of damage and JSON file with information about hazard and fragilities. The detail information about the analysis in our manual: Building damage analysis
Input parameters
key name |
type |
name |
description |
|---|---|---|---|
|
|
Result name |
Name of the result dataset. |
|
|
Hazard type |
Hazard type (earthquake, tsunami, tornado, hurricaneWindfields). |
|
|
Hazard id |
ID of the hazard from the Hazard service. |
|
|
Fragility key |
Fragility key used in mapping dataset. |
|
|
Liquefaction |
Use liquefaction, if applicable to the hazard. |
|
|
Uncertainty |
Use hazard uncertainty. |
|
|
Number of CPUs |
Number of CPUs used for parallel computation. |
Input datasets
key name |
type |
name |
description |
|---|---|---|---|
|
|
Building dataset |
A building dataset. |
|
|
DFR3 Mapping Set |
DFR3 Mapping Set. |
Output datasets
key name |
type |
parent key |
name |
description |
|---|---|---|---|---|
|
|
|
Results |
A dataset containing results |
|
|
|
Results |
Information about applied hazard value and fragility |
(* required)
from pyincore.analyses.buildingdamage import BuildingDamage
Run Damage with earthquake#
# Define the variables to be used for input parameters

hazard_type = "earthquake"
hazard_id = "5b902cb273c3371e1236b36b"

result_name = "memphis_eq_bldg_dmg_result"

# Default Building Fragility mapping
mapping_id = "5b47b350337d4a3629076f2c"
# create fragility mapping object with id
eq_mapping_set = MappingSet(fragility_services.get_mapping(mapping_id))
# Create building damage analysis object
eq_bldg_dmg = BuildingDamage(client)

# Load local dataset (building inventory)
eq_bldg_dmg.set_input_dataset("buildings", local_buildings)

# Load fragility mapping
eq_bldg_dmg.set_input_dataset("dfr3_mapping_set", eq_mapping_set)

eq_bldg_dmg.set_parameter("result_name", result_name)
eq_bldg_dmg.set_parameter("hazard_type", hazard_type)
eq_bldg_dmg.set_parameter("hazard_id", hazard_id)
eq_bldg_dmg.set_parameter("num_cpu", 1)
# Run building damage analysis
eq_bldg_dmg.run_analysis()
Take a glance of the output#
eq_bldg_dmg_table = eq_bldg_dmg.get_output_dataset("ds_result").get_dataframe_from_csv()
eq_bldg_dmg_table.head()
3.4 Post-process and Vizualize the Damage Analysis Output#
Joining dataset#
Data preparation and data post-processing are common procedures. Prior to using pyIncore, users often encounter situation that they need to reshape their own dataset to make it compliant with the input dataset format of pyIncore.
For example, adding GUID to inventory dataset. GUID (aka UUID) is an acronym for ‘Globally Unique Identifier’. It is a 128-bit integer number used to identify resources. In IN-CORE We require each individual row/item in an inventory to have its own GUID. If your dataset does not come with GUID, pyIncore has utility method to help you add it.
After acquiring outputs from pyIncore analyses, often time user would need to perform data aggregation to gain statitical insights. The below tutorial gives a few examples on how to join datasets and generate some basic visualizations.
# getting dataframe of damage output
eq_bldg_dmg_df = eq_bldg_dmg.get_output_dataset("ds_result").get_dataframe_from_csv()

# getting geodataframe of building dataset
bldg_gdf = local_buildings.get_dataframe_from_shapefile()

# merge/join two dataframe
# you can choose columns to be merged
bldg_dmg_gdf = bldg_gdf[['guid', 'struct_typ', 'geometry']].merge(eq_bldg_dmg_df, on='guid')
bldg_dmg_gdf.head()
Display tabular data#
You can use Pandas and GeoPandas to dispaly tabular data and create charts. This secsion shows some examples.
Describe#
# Stat summary on a column
bldg_dmg_gdf["LS_0"].describe()
Sort#
# Show table sorted by DS_3 (decending) and struct_typ (ascending)
bldg_dmg_gdf.sort_values(['DS_3', 'struct_typ'], ascending=[0,1]).head()
Group by#
# Show table group by Structure type
grouped_bldg_dmg = bldg_dmg_gdf.groupby(by=['struct_typ'], as_index=True)\
.agg({'DS_0': 'mean', 'DS_1':'mean', 'DS_2': 'mean', 'DS_3': 'mean', 'guid': 'count'})
grouped_bldg_dmg.rename(columns={'guid': 'total_count'}, inplace=True)
grouped_bldg_dmg.head()
Simple barchart using pandas#
# Plot Damage state by structure type
ax = grouped_bldg_dmg[["DS_0", "DS_1", "DS_2", "DS_3"]].plot.barh(stacked=True)
ax.set_title("Stacked Bar Chart of Damage State Grouped by Structure Type", fontsize=12)
ax.set_xlabel("complete damage value", fontsize=12)
ax.legend(loc='center left', bbox_to_anchor=(1.0, 0.5)) #here is the magic
# Create a histogram with DS_3
ax = bldg_dmg_gdf['DS_3'].hist(bins=20, figsize=[10,5])
ax.set_title("complete damage distribution", fontsize=12)
ax.set_xlabel("complete damage value", fontsize=12)
ax.set_ylabel("counts", fontsize=12)
Using pyIncore-viz#
pyIncore-viz is a Python visualization package for pyIncore module. It provides users with convenient methods to create image and graphic outputs of various hazard IN-CORE analyses.
Plot Geospatial Map#
Plotting a geospatial map is generating static image of a map.
from pyincore_viz.geoutil import GeoUtil as geoviz
# Plot earthquake
eq_id = "5b902cb273c3371e1236b36b"
geoviz.plot_earthquake(eq_id, client)
# Plot a map with a Dataset
# with local dataset (local_buildings)
geoviz.plot_map(local_buildings, column='struct_typ',category='True')
# Plot a map with GeoDataframe

geoviz.plot_gdf_map(bldg_dmg_gdf, 'DS_3', basemap=False)
# Overlay GeoDataFrame with a base map
geoviz.plot_gdf_map(bldg_dmg_gdf, 'DS_3', basemap=True)
# Interactive map with Dataset
# addjust additional multiplier to increase the intensity of heatmap, e.g. multipler=1000
map = geoviz.plot_heatmap_from_gdf(bldg_dmg_gdf, "DS_3", radius=7, blur=5, name="DS_3", multiplier=1000)
map